The picture needs a question
A cricket chart is a visual arrangement of selected quantities. It can make a relationship easier to see, but it cannot supply a missing definition or repair incompatible inputs. Before accepting the impression of a rising line or a long bar, ask what question the chart was built to answer. This note uses an invented innings dataset to show a practical inspection order: question, labels, sample, scale and conclusion. It is an original reading exercise rather than an analysis of real players.
A useful question is specific. Which player accumulated the most runs in a defined tournament differs from which player scored fastest in the selected innings. Both may be interesting, but they need different measures. If the chart supplies a total, do not describe it as a rate. If it supplies a rate, look for the counts behind it. The visual form is most useful when it keeps the evidence for the intended comparison accessible.
Recover the underlying values
Imagine a chart with three invented innings totals: 28, 35 and 42. Write them into a small table before interpreting the graphic. Label the rows as separate innings and the values as runs. The mean is 35 and the range is 14. These two summaries describe different properties of the selected figures. The table does not establish the match situations, number of balls faced or quality of opposition, and the chart should not imply that those absent details have been measured.
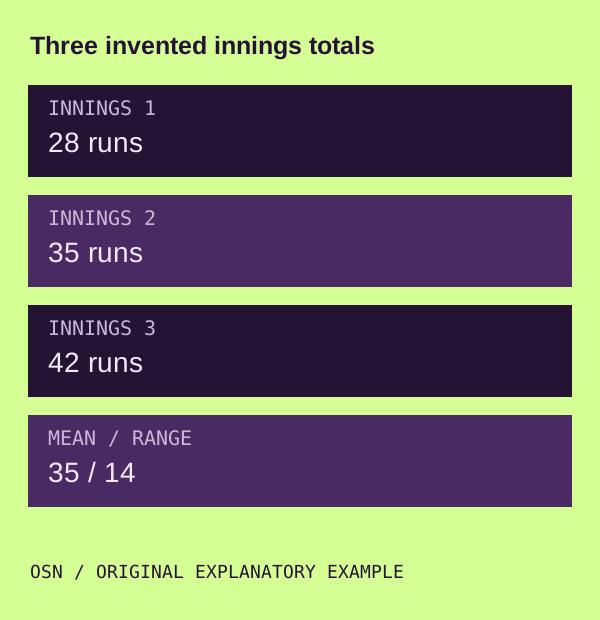
Now ask how the innings were selected. Are they three consecutive innings, three available records or three chosen highlights? Each description changes the sample's meaning. A claim about consistency requires a record appropriate to that claim, not merely the most attractive examples. Keep the selection rule beside the values. A graph can be perfectly accurate about three chosen points while still being misleading if the caption presents them as an entire career.
Read the unit before the height
An axis label tells you what the distance on the page represents. Runs, wickets, legal balls and rates are different quantities. The same numerical value can have different meanings when attached to different units. If the unit is absent, mark the chart as insufficient for the proposed conclusion. Do not assume that a familiar-looking number must be the measure you expected. A visual comparison begins with the labels, not with the apparent winner.
Check whether the chart changes measures between panels. One panel might show total runs and another strike rate. Equal bar lengths across those panels do not imply equal performance because the scales describe different things. Read each panel independently before connecting them into a narrative. A comparison can use several measures, but the explanation should tell the reader which question each measure answers and where the measures cannot be combined directly.
Inspect the scale and baseline
The invented values 28, 35 and 42 can look relatively close on a scale from zero to 100. They look much farther apart on a scale from 25 to 45. The underlying figures have not changed. A narrower scale can help inspect variation, but it should be visible and justified by the reading task. Bars encourage length comparisons, so a truncated baseline especially deserves attention. Do not calculate the ratio of bar heights when the baseline does not represent zero.
A cropped screenshot can remove precisely the scale needed to interpret it. Find the full image or the original source before repeating the strongest visual impression. If you cannot recover the scale, describe that limitation in your note. A confidently worded caption cannot replace the missing axis. Nor does a dramatic colour palette increase the amount of evidence contained in the three values. Presentation affects attention; it does not create additional observations.
Distinguish time from category order
A line connecting points often suggests a sequence. Confirm that the horizontal axis actually represents time or another ordered relationship. Three players sorted by total are categories, not stages of one player's progress. Connecting them can still be a design choice, but the reader should not interpret the slope as improvement over time. The order is part of the chart's construction and should remain visible in the explanation.
If the axis is chronological, inspect the intervals. Equally spaced points may represent unequal gaps in dates. Missing periods can disappear when only available records are plotted. A smooth connecting line can imply continuity across an unobserved interval. Keep unavailable observations distinct from zeros. Our missing-data note explains why filling those gaps without evidence can change both the arithmetic and the visual story.
Separate cumulative and local change
A cumulative run chart carries earlier runs into each later point. Its upward direction is not, by itself, evidence of a rising scoring rate. To discuss pace, inspect compatible intervals or calculate from the additional runs and legal deliveries. A cumulative total and an interval rate can both be useful views of an innings, but the first should not silently serve as evidence for the second. Read the chart's definition before naming the pattern.
Overs notation can complicate a rate chart if it is treated as a decimal. Under ordinary six-ball-over notation, 8.2 is 50 legal balls, not 8.2 decimal overs. A smooth graph does not reveal whether the conversion was correct. Check a source point and its denominator when the claim depends on the arithmetic. Formal format context is available through the ICC overview, while a real competition still requires its applicable conditions.
Read the legend on a small screen
Colours, symbols and line styles identify series. Look for labels that remain understandable without relying on colour alone. A distinction visible on a large monitor can vanish after a chart is compressed into a phone-sized image. Open a larger version where possible, and do not infer a series identity from the colour associated with a team in another graphic. Legends can change even within a collection from the same publisher.
If a benchmark appears, distinguish it from observed data. An average, threshold or reference line is part of the interpretive framework. It is not another player's innings. Read how it was calculated and which sample it uses. A comparison against an unexplained benchmark can look persuasive while remaining difficult to inspect. A good caption names both the series and the reference so that the reader understands what the visual gap actually represents.
Write the chart without the picture
Try describing the invented dataset in plain text. Three selected innings contain 28, 35 and 42 runs; their mean is 35; the selection rule and match circumstances remain unspecified. That sentence is less dramatic than a graphic, but it establishes the evidence clearly. If the chart's headline says much more, identify which additional source supports the stronger claim. If there is none, narrow the headline rather than decorating the graph further.
The OSN cricket reference index connects chart reading with arithmetic and sample questions. Cricketin is a sponsored partner reading reference, separate from the records needed for an actual dataset. Keep the question, unit and sample with any chart you share. A useful image makes a defined relationship easier to inspect; it should not require the reader to mistake a strong visual impression for a stronger body of evidence.